Email Analytics
Email analytics provide detailed insights into how your email campaigns are performing, helping you understand your audience engagement and optimize your email marketing strategy.
This feature is currently in beta, which means you may encounter bugs. Please report them in our Discord group if you run into any issues.
Before you start: If your school is hosted on courselit.app, you need to get approved to send marketing emails. Request access here.
Accessing Email Analytics
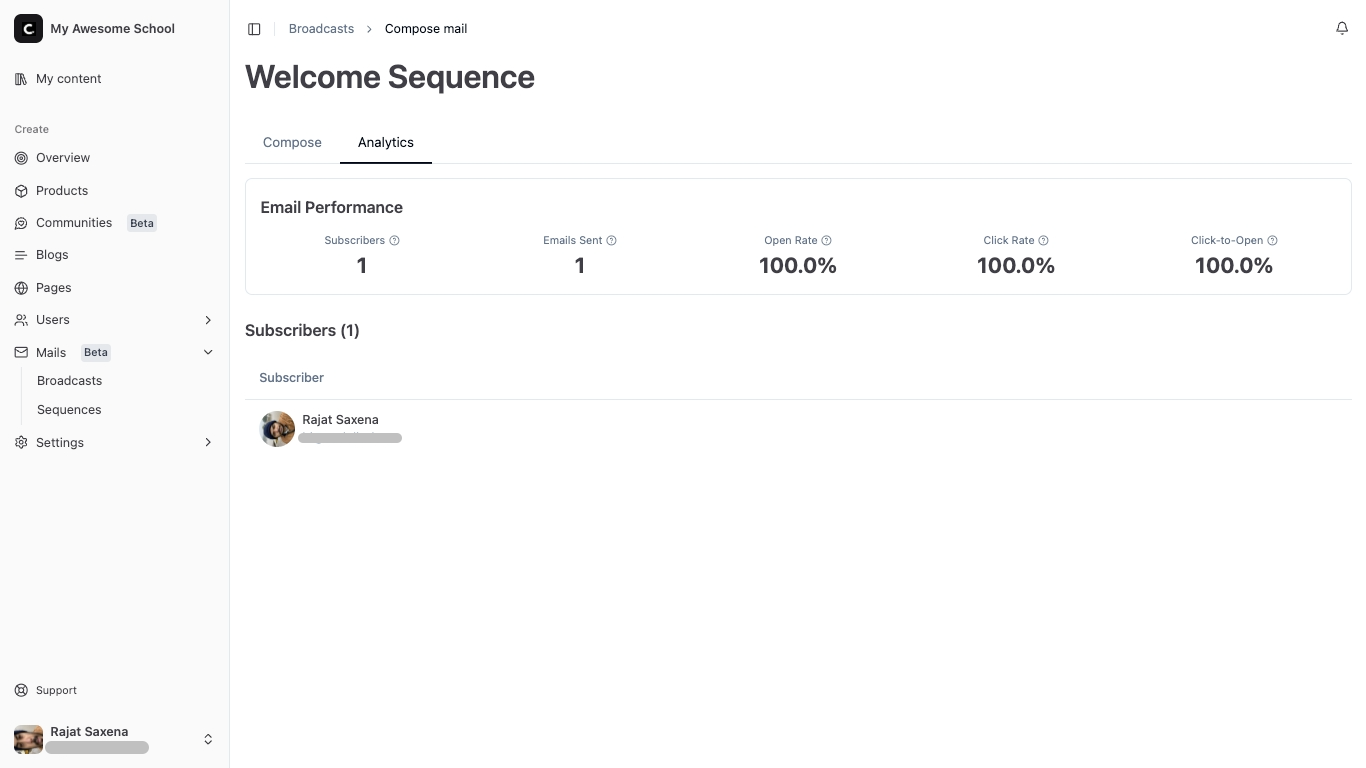
From the Dashboard, go to Mails and select any broadcast or sequence you’ve sent. You’ll see two tabs at the top:
- Compose: For creating and editing emails
- Analytics: For viewing performance metrics
Click on the Analytics tab to access detailed performance data for your email campaign.
Understanding Email Performance Metrics
The analytics dashboard is divided into two main sections that provide comprehensive insights into your email campaign performance.
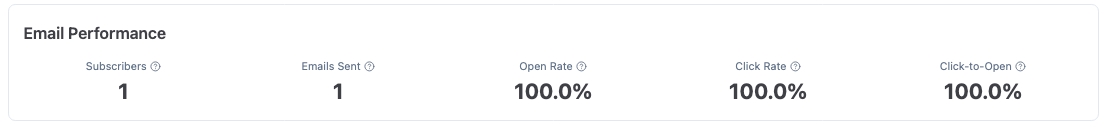
Email Performance Section
This section displays key performance indicators (KPIs) that help you understand how your email campaign is performing. Each metric is presented with a question mark icon (?) that provides additional context when hovered over.
Subscribers
- What it shows: The total number of subscribers who were targeted by this email campaign
- How it’s calculated: Based on the filters you applied when creating the broadcast OR the number of subscribers in the sequence
- Why it matters: Helps you understand the reach of your campaign
Emails Sent
- What it shows: The actual number of emails that were successfully sent
- How it’s calculated: Total emails dispatched
- Why it matters: Confirms that your emails are being delivered to your audience
Open Rate
- What it shows: The percentage of emails that were opened by recipients
- How it’s calculated: (Number of opened emails ÷ Total emails sent) × 100
- Why it matters: Indicates how engaging your subject lines and sender reputation are
- Industry benchmark: Typically ranges from 15-25% for most industries
Click Rate
- What it shows: The percentage of emails that resulted in at least one link click
- How it’s calculated: (Number of emails with clicks ÷ Total emails sent) × 100
- Why it matters: Measures the effectiveness of your email content and call-to-action buttons
- Industry benchmark: Usually between 2-5% for most campaigns
Click-to-Open Rate
- What it shows: The percentage of opened emails that resulted in at least one click
- How it’s calculated: (Number of emails with clicks ÷ Number of opened emails) × 100
- Why it matters: Shows how compelling your email content is to engaged readers
- Industry benchmark: Typically 10-20% for well-performing campaigns
Subscribers Section
This section provides detailed information about individual subscribers.
Interpreting Your Analytics
High Performance Indicators
- Open Rate > 20%: Your subject lines are compelling and your sender reputation is good
- Click Rate > 3%: Your email content is engaging and calls-to-action are effective
- Click-to-Open Rate > 15%: Your email content resonates well with your audience
Areas for Improvement
- Low Open Rate: Consider improving subject lines, sender name, or timing
- Low Click Rate: Review your email content, design, and call-to-action placement
- Low Click-to-Open Rate: Focus on making your content more compelling for engaged readers
Next Steps
Now that you understand your email analytics, you can:
Stuck Somewhere?
We are always here for you. Come chat with us in our Discord channel or send a tweet to @CourseLit.